Product infographic carousel
Product infographic images
Product Infographic captions
-
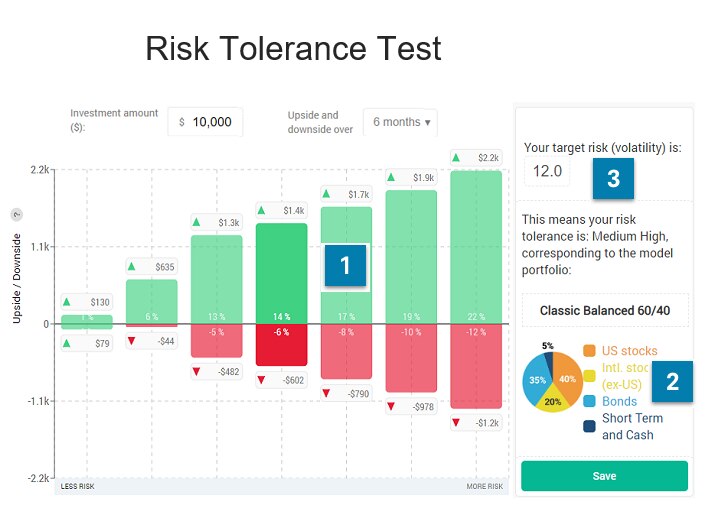
1
Our state-of-the-art Risk Tolerance Test is easy to use. Each bar represents the upside and downside of a model portfolio, and the client simply chooses the one that he/she feels most comfortable with.
-
2
The result directly maps to a model portfolio used by your firm.
-
3
The client's target volatility is the long-term average volatility of the model portfolio. Monitor the client's risk exposure regularly to make sure it stays in line with the target volatility
-
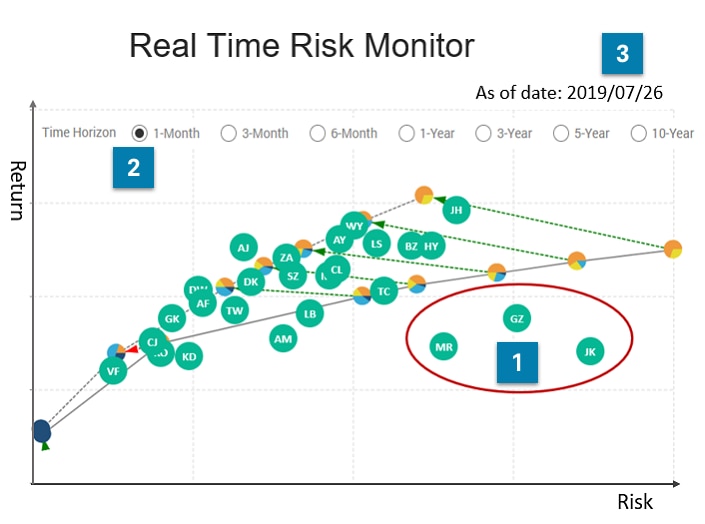
1
This risk-return chart helps you quickly identify at-risk clients. Each green dot represents a client portfolio, and the ones on the lower right corner need attention.
-
2
Visualize risks in the short-term, medium-term and longer-term to get a complete picture. It is like the 3D X-Ray.
-
3
Calculated daily to give you the latest. You can also use this chart with one client at a time to help you make better-informed decisions and reduce panic.
-
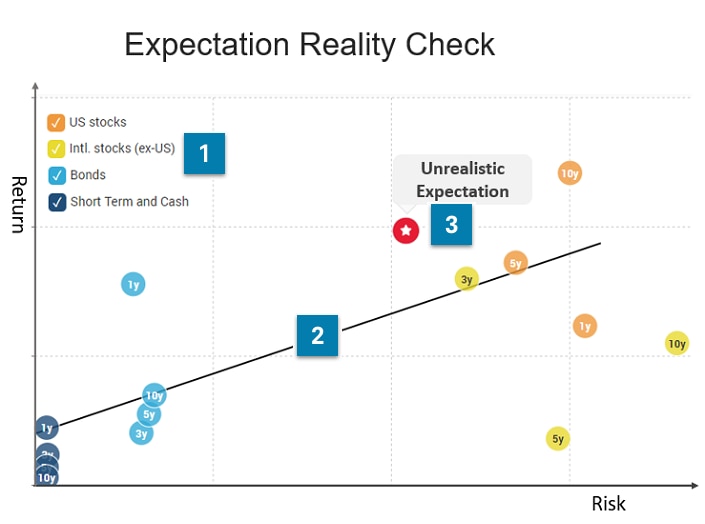
1
Check client expectations against the realities of key markets in the short-term (not shown), medium-term and longer-term.
-
2
This is the best fit line, indicating realistic expectations.
-
3
If the client's risk tolerance level and expected return falls above the line, the expectation is not realistic.
Product Description
About this Product
Our state-of-the-art Risk Tolerance Test is easy to use. Each bar represents the upside and downside of a model portfolio, and the client simply chooses the one that he/she feels most comfortable with.
About Andes Wealth Technologies
Are you an advisor looking for a modern approach to get ahead? Introducing the Google Maps for Advisors*, a set of UNIQUE, MODERN tools to help you navigate markets and emotions. Founded by an award-winning FinTech veteran, Andes Wealth Technologies empowers advisors to deliver a superb client experience using 360? visualizations for risk and behavior. Do you dread client calls after the market drops? The Google Maps for Advisors helps to protect clients in down markets, fully participate in up markets and reduce panic in zigzags. Uninspiring routine reviews? No more. Make every conversation count. Delight clients, convert prospects and get ahead of your robo- and human peers. *Google and Google Maps are registered trademarks of Google LLC.
Other Products from Andes Wealth Technologies
0719-93C0
API integration is available through Schwab OpenView Gateway®, which is provided by Performance Technologies, Inc. (“PTI”). Single sign-on is provided by PTI. Daily data files and trading integration are available through Charles Schwab & Co., Inc. ("CS&Co"), a registered broker-dealer and member SIPC. Not all third party providers listed on this site have integration agreements with Schwab. Schwab OpenView Gateway® and Schwab OpenView MarketSquare™ are services of PTI.
References to third parties on this site (whether such parties are vendors participating in a service of PTI or independent advisors using a service of a participating vendor) are not an endorsement or recommendation of, or an opinion (favorable or unfavorable), or advice about, or a referral to any product or service of any third party. Advisors are solely responsible for evaluating, selecting, and purchasing products and services offered by third party vendors. Unless indicated otherwise, third parties are independent and not affiliated with PTI or its affiliates.
Schwab Advisor Services includes the custody, trading, and support services of Charles Schwab & Co., Inc. ("CS&Co"), a registered broker-dealer and member SIPC, and the technology products and services of PTI. PTI and CS&Co are separate companies affiliated as subsidiaries of The Charles Schwab Corporation, but their products and services are independent of each other. PTI’s integration solutions integrate data about accounts custodied at CS&Co.
Access to Electronic Services may be limited or unavailable during periods of peak demand, market volatility, systems upgrade, maintenance, or for other reasons.