Product infographic carousel
Product infographic images
Product Infographic captions
-
1
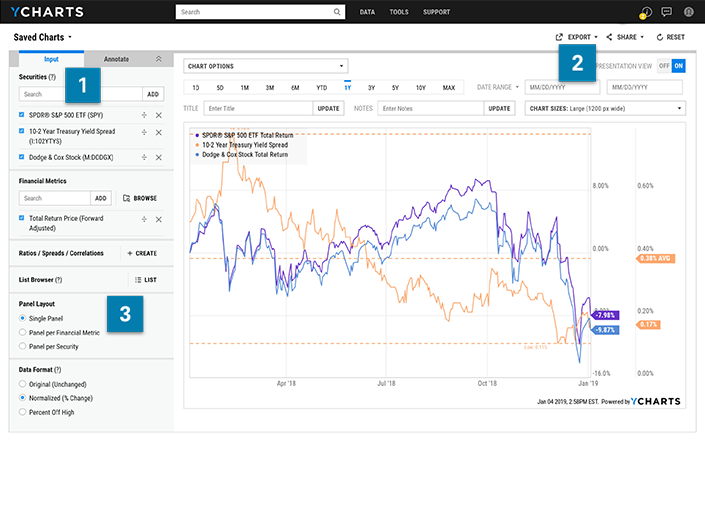
“Visualize thousands of metrics for more than 20,000 equities, 60,000 funds, 15,000 indices and 250,000 economic indicators”
-
2
“Add your firm’s logo, custom colorway, personalized title, and callouts in ‘presentation view’”
-
3
“Present your insights in a visually compelling manner. Change the chart layout and data format to tell the story you want to clients and prospects"
-
1
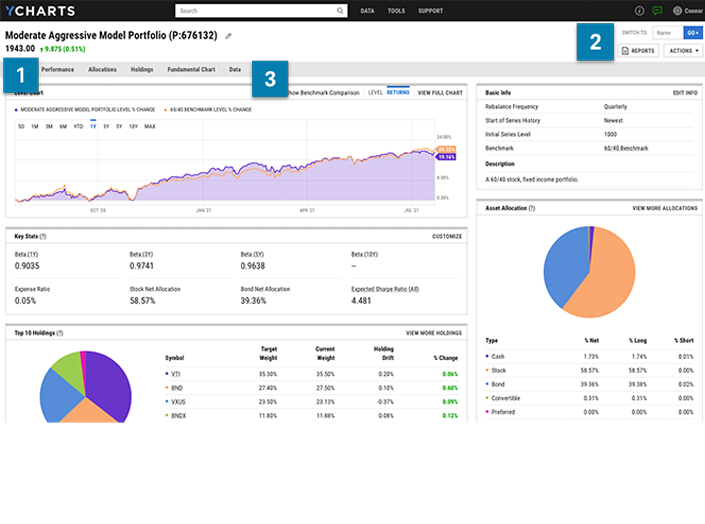
“Upload your Model Portfolios to YCharts to easily and regularly view key stats, performance vs. a benchmark, and allocation or exposure data.”
-
2
“Create Portfolio Comparison or Overview Reports in PDF format to present strategies to clients—and customize with firm branding, disclosures, and data of your choosing.”
-
3
“When presenting to clients, use the Chart, Holdings, Allocations, and Performance tabs to review key insights and changes made to the portfolio since you last met”
-
1
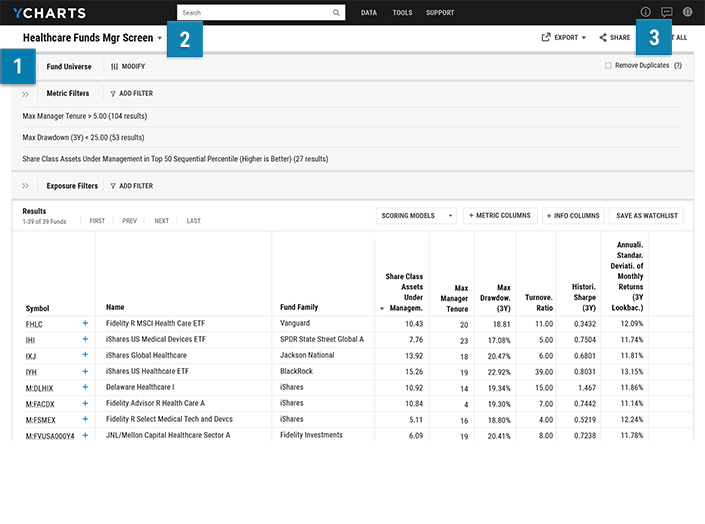
“The YCharts Fund Screener narrows a universe of over 45,000 mutual funds, ETFs and CEFs to ensure a thorough selection process”
-
2
“Pre-built screening templates use commonly employed criteria and popular categories to provide a starting point for better fund selection”
-
3
"Screens can easily be saved and shared with other users for better collaboration”
Product Description
About this Product

Investment research platform designed for today’s RIA
- Data for stocks, funds, ETFs, SMAs & economic indicators
- Portfolio analytics for strategy optimization & communication
- Powerful visualization and sales enablement tools
About YCharts
Ranked the “Investment Data” market leader and #1 most adopted tech in the last year by the 2022 Kitces Report as well as “Top investment/data analytics tool” in the 2022 T3 Survey, YCharts is a fast-growing investment research platform that enables smarter investment decisions and better client communications. Serving asset managers, advisors, and financial planners, YCharts helps wealth managers demonstrate their value to clients and prospects with a suite of intuitive tools that enhance client engagements and simplify complex financial topics. Ideal for security research, portfolio construction, client communication, and market monitoring, YCharts empowers advisors to save time and deliver greater client satisfaction.
Product Details
Contact Us
More info about us
0719-93C0
API integration is available through Schwab OpenView Gateway®, which is provided by Performance Technologies, Inc. (“PTI”). Single sign-on is provided by PTI. Daily data files and trading integration are available through Charles Schwab & Co., Inc. ("CS&Co"), a registered broker-dealer and member SIPC. Not all third party providers listed on this site have integration agreements with Schwab. Schwab OpenView Gateway® is a service of PTI.
References to third parties on this site (whether such parties are vendors participating in a service of PTI or independent advisors using a service of a participating vendor) are not an endorsement or recommendation of, or an opinion (favorable or unfavorable), or advice about, or a referral to any product or service of any third party. Advisors are solely responsible for evaluating, selecting, and purchasing products and services offered by third party vendors. Unless indicated otherwise, third parties are independent and not affiliated with PTI or its affiliates.
Schwab Advisor Services includes the custody, trading, and support services of Charles Schwab & Co., Inc. ("CS&Co"), a registered broker-dealer and member SIPC, and the technology products and services of PTI. PTI and CS&Co are separate companies affiliated as subsidiaries of The Charles Schwab Corporation, but their products and services are independent of each other. PTI’s integration solutions integrate data about accounts custodied at CS&Co.
Access to Electronic Services may be limited or unavailable during periods of peak demand, market volatility, systems upgrade, maintenance, or for other reasons.


