First Quarter 2026 Earnings: Feelin' Alright

Key takeaways
- First quarter 2026 earnings momentum is materially stronger than expected. S&P 500 earnings growth is tracking near 28% year over year with beat rates above historical medians, supporting expectations for potential continued strength into the second quarter absent a major macro shift.
- Revisions are concentrated rather than broad-based: Technology and Communication Services (plus select Consumer Discretionary drivers) account for a disproportionate share of upside, and the "Magnificent 7" (Mag7) continue to outgrow the other 493 S&P 500 companies by a wide margin, delaying the long-anticipated "convergence trade."
- Risk is rising even as the scorecard looks good. Miss penalties are unusually severe and margins are near cycle highs, leaving less cushion if growth slows or costs reaccelerate—conditions that also increase rotation and mean-reversion risk across sectors.
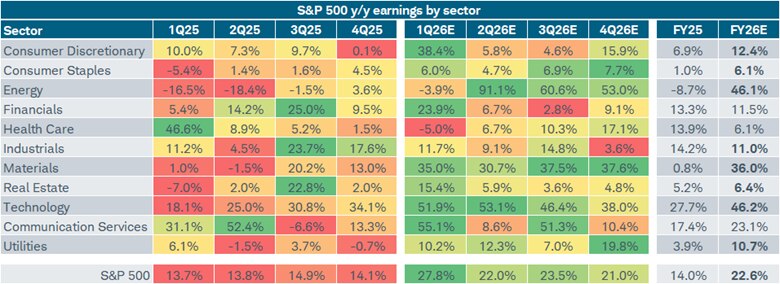
With a meaningful portion of the S&P 500 having reported first quarter 2026 earnings, the growth rate is tracking at nearly 28% year over year, which is nearly double the consensus that prevailed at the start of this year. That 13-plus percentage point upward revision is one of the more pronounced positive intra-quarter upgrades in recent cycles and reflects a combination of genuine outperformance—particularly in the Technology and Communication Services sectors—as well as a base period that was softer in some cyclical pockets of the market, like the Materials sector.
So far during this reporting season, both the earnings and revenues beat rates have moved higher and are tracking well above historical medians. Absent a significant shift in the macro landscape, it's expected that earnings growth can remain strong in the second quarter.
As shown below, the first quarter (1Q26) column is a sea of green, other than for the Health Care and Energy sectors. Though in the case of the latter, a massive acceleration is on tap for the remaining quarters of the year, in part courtesy of the Iran war-related spike in oil prices.
Source: Charles Schwab, LSEG I/B/E/S, as of 5/1/2026.
S&P 500 sectors shown. Sectors are based on the Global Industry Classification Standard (GICS®), an industry analysis framework developed by MSCI and S&P Dow Jones Indices to provide investors with consistent industry definitions. Forecasts contained herein are for illustrative purposes only, may be based upon proprietary research and are developed through analysis of historical public data. Color scale applied to each sector row with dark green indicating strongest y/y earnings growth and dark red indicating weakest y/y earnings growth. Bolded FY26 percentages indicate higher y/y earnings growth relative to FY25. Indexes are unmanaged, do not incur management fees, costs and expenses and cannot be invested in directly. Past performance does not guarantee future results.
The sector-level data for the first quarter of 2026 reveals some concentration in terms of upward revision drivers. Consumer Discretionary's estimate jumped to 38%, largely reflecting tariff pull-forward dynamics and specific large cap contributions, notably from Amazon. Communication Services saw a similarly dramatic re-rating, with the first quarter estimate jumping to 52%, largely driven by Alphabet.
| Sector | 5/1/2026 | 1/1/2026 | Change |
|---|---|---|---|
| Consumer Discretionary | 38.4% | 6.3% | 32.1% |
| Consumer Staples | 6.0% | 6.6% | -0.6% |
| Energy | -3.9% | 1.3% | -5.2% |
| Financials | 23.9% | 16.7% | 7.2% |
| Health Care | -5.0% | 5.5% | -10.5% |
| Industrials | 11.7% | 7.6% | 4.1% |
| Materials | 35.0% | 23.3% | 11.7% |
| Real Estate | 15.4% | 13.1% | 2.3% |
| Technology | 51.9% | 35.8% | 16.1% |
| Communication Services | 55.1% | -2.7% | 57.8% |
| Utilities | 10.2% | 8.8% | 1.4% |
| S&P 500 | 27.8% | 14.4% | 13.4% |
The estimate now sits at nearly 23% for the full calendar year 2026, up from less than 16% at the January 1 consensus, driven disproportionately by a handful of high-momentum sectors (and individual stocks) rather than broad-based upward revisions. Only the Energy sector has notable breadth in terms of the stocks contributing to rising earnings expectations. The other three top sectors have much more concentration: Alphabet is the biggest driver of the upward trajectory of estimates for Communication Services. Tech's outsized earnings growth expectation is somewhat concentrated among Sandisk, Micron, Intel, and Broadcom. And in the case of Materials, the top drivers are Dow and Albermale.
| Sector | 5/1/2026 | 1/1/2026 | Change |
|---|---|---|---|
| Consumer Discretionary | 12.4% | 11.4% | 1.0% |
| Consumer Staples | 6.1% | 7.3% | -1.2% |
| Energy | 46.1% | 7.8% | 38.3% |
| Financials | 11.5% | 9.5% | 2.0% |
| Health Care | 6.1% | 9.2% | -3.1% |
| Industrials | 11.0% | 15.6% | -4.6% |
| Materials | 36.0% | 20.9% | 15.1% |
| Real Estate | 6.4% | 7.7% | -1.3% |
| Technology | 46.2% | 30.8% | 15.4% |
| Communication Services | 23.1% | 10.5% | 12.6% |
| Utilities | 10.7% | 9.4% | 1.3% |
| S&P 500 | 22.6% | 15.6% | 7.0% |
Mag7 convergence?
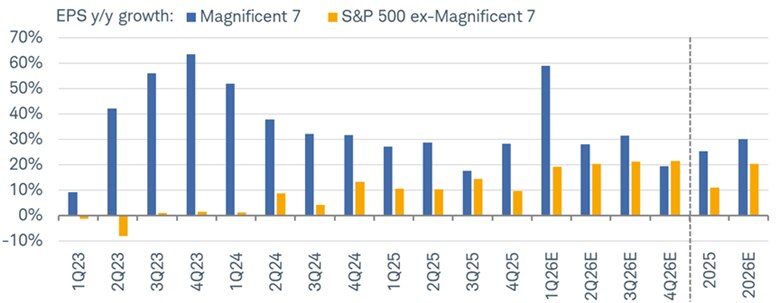
Another way to slice and dice the S&P 500 is to compare the earnings growth rates of the Magnificent 7 (Mag7) cohort (Alphabet, Amazon, Apple, Meta, Microsoft, Nvidia, and Tesla) and the ex-Mag7 (the other 493). According to the London Stock Exchange Group's Institutional Brokers' Estimate System (LSEG I/B/E/S), the Mag7 cohort is estimated to grow earnings by nearly 60% in the first quarter of 2026, extending a run that has ranged in percentage terms from the high teens to the low 60s since mid-2023. The other 493 is tracking closer to 19%—a historically solid reading, but the gap remains wide.
Convergence coming
Source: Charles Schwab, LSEG I/B/E/S, as of 5/1/2026.
"Magnificent 7" (Mag7) represents Alphabet, Amazon, Apple, Meta, Microsoft, NVIDIA, and Tesla. All corporate names and market data shown above are for illustrative purposes only and are not a recommendation, offer to sell, or a solicitation of an offer to buy any security. Forecasts contained herein are for illustrative purposes only, may be based upon proprietary research and are developed through analysis of historical public data. Indexes are unmanaged, do not incur management fees, costs and expenses and cannot be invested in directly. Past performance does not guarantee future results.
The expected "convergence trade"—when the broader market's earnings growth catches up to mega-cap AI beneficiaries—has been repeatedly pushed out. For calendar year 2026, estimates suggest Mag7 earnings growth of about 30% versus about 20% for the other 493. However, note that it's expected that the other 493's earnings growth rate may actually exceed the Mag7's in the fourth quarter of 2026.
Don't miss it!
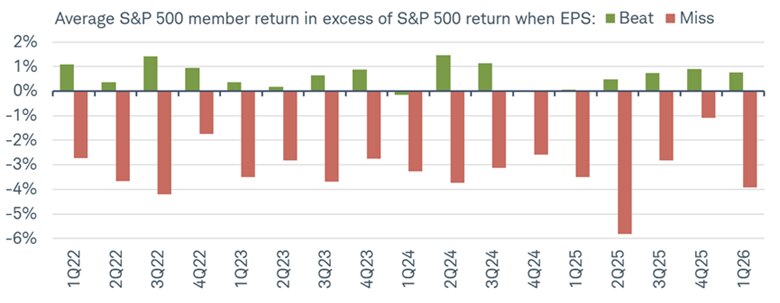
One of the most notable signals from first quarter 2026 earnings is the severity of the miss penalty. The average excess return (on the first trading day after an earnings release) for a company that has beaten estimates is running around 0.7% relative to the S&P 500, which is roughly in line with historical norms. On the other hand, companies that miss have seen stocks' average excess returns of around -3.9%, which is the most severe punishment since the second quarter of 2025's extreme -5.8% reading and at the low end of the -2.0% to -4.0% range that prevailed through much of 2022-2024.
Misses' punishment
Source: Charles Schwab, Bloomberg, as of 5/1/2026.
Member price performance in excess of S&P 500 based on gain or loss following day in which earnings are reported. Indexes are unmanaged, do not incur management fees, costs and expenses and cannot be invested in directly. Past performance does not guarantee future results. Dividends and interest are assumed to have been reinvested, and the example does not reflect the effects of taxes or fees which would cause performance to be lower.
This asymmetry has two interpretations. The charitable read: the market is efficiently repricing companies that fail to deliver in an environment where expectations are elevated and macro uncertainty (war, tariffs, Federal Reserve policy, etc.) is high. The less charitable read: it signals fragility—investor positioning is stretched on the long side in high-expectation names, and the air pocket on a miss is wider than the reward for confirmation. That dynamic is worth monitoring as we move through the latter stage of reporting season, particularly for mega-cap names where consensus has been repeatedly upgraded.
By a wide margin
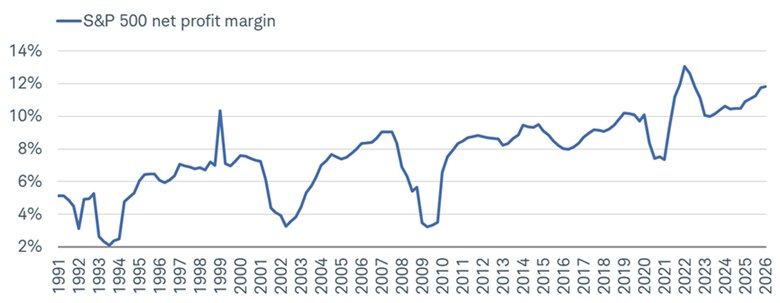
It's not just profits that are in focus, but profit margins as well. According to Bloomberg, S&P 500 net profit margins are tracking near 12%—which is close to the post-pandemic expansion highs and well above the 7-8% range that characterized most of the 2010s. The elevated margin structure is a key support for the earnings growth story—but it also represents a vulnerability. In a somewhat-stagflationary environment where input cost pressures are rising while revenue growth may decelerate alongside slowing economic growth, concerns about margin compression are rising.
No margin for error?
Source: Charles Schwab, Bloomberg, as of 3/31/2026.
Indexes are unmanaged, do not incur management fees, costs and expenses and cannot be invested in directly. Past performance is no guarantee of future results.
The 1999-2000 spike in margins was followed by a sharp contraction as the dot-com cycle turned, while the Global Financial Crisis trough touched below 3.5%. Today's margins, which are near the highest in the 35-year series, means that even modest margin compression would represent a meaningful headwind to earnings growth. That's not our base case, but it does represent a risk for the market. Margins near historical highs are a double-edged sword. They reflect the index's increasingly software-and-platform-heavy composition, which are structurally higher margin businesses, but they also leave less cushion if cost pressures accelerate.
Rotations abound
The trailing 12-month sector leaderboard through the end of April shows Communication Services, Tech, and Energy as the clear performance standouts—exactly the sectors in which earnings revisions have been strongest. Health Care and Consumer Staples sit at the bottom—exactly the sectors in which earnings revisions have been most negative. Notable however, is how rotational the market has been on a month-to-month basis, with sectors like Communication Services and Tech jumping all over the leaderboard.
Sector rotations
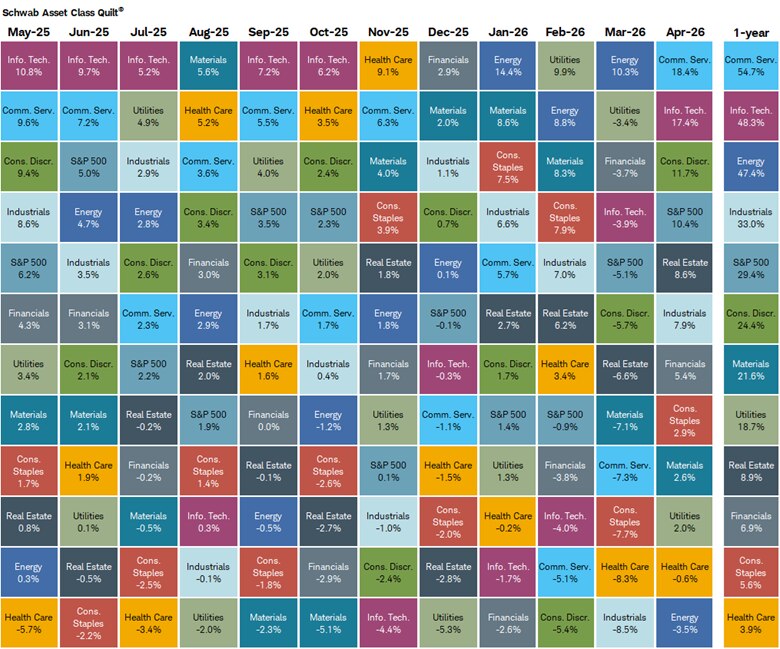
Source: Charles Schwab, Bloomberg, as of 4/30/26.
Sector performance is represented by price returns of the following 11 Global Industry Classification Standard (GICS®) sector indices: Consumer Discretionary Sector, Consumer Staples Sector, Energy Sector, Financials Sector, Health Care Sector, Industrials Sector, Information Technology Sector, Materials Sector, Real Estate Sector, Communication Services Sector, and Utilities Sector. Returns of the broad market are represented by the S&P 500. Indexes are unmanaged, do not incur management fees, costs and expenses and cannot be invested in directly. Past performance is no guarantee of future results.
The sector "quilt" confirms that the market has been appropriately pricing sector-level earnings differentiation, but also that the gap between winners and laggards is historically wide, raising rebalancing and mean-reversion risk.
In sum
Earnings have been strong, with double-digit growth across most sectors, a substantial upward revision to the consensus since January, margins holding near cyclical highs, and the Mag7 delivering another quarter of outsized AI-monetization gains. This is validation, for now, that the economic cycle remains intact despite macro headwinds.
The current near-23% full-year S&P 500 earnings estimate remains ambitious against the backdrop of below-trend economic growth and above-target inflation. It's a combination that has historically created a difficult operating environment for profit margins. In short: the scorecard looks good. But the field conditions for the next few quarters are more challenging than the first quarter 2026's results alone would suggest.