Looking to the Futures
Markets Stall on Iran and Fed Concerns

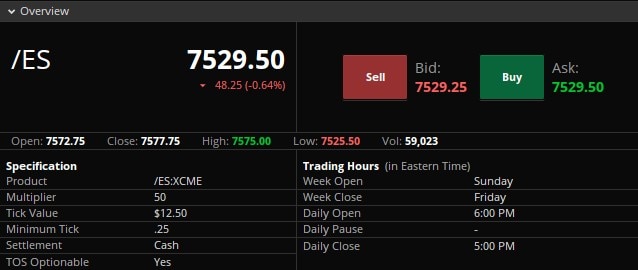
Stocks' mid-week rebound came to an abrupt halt on Thursday as semiconductor weakness, escalating tensions with Iran, and lingering inflation concerns overshadowed the encouraging developments of the previous two sessions. September S&P 500 futures (/ESU26) fell nearly 0.50%, settling at 7,577.75. Nasdaq futures (/NQU26) bore the brunt of the selling, dropping more than 1.5%, while Dow futures (/YMU26) proved relatively resilient, shedding just 0.2% on the day.
Thursday marked the 139th day since the Iran war began on February 28. For many, however, the conflict feels as though it has lasted much longer. In the latest developments, a spokesperson for Iran's top military command warned that the country would target key U.S. assets in the Middle East if recent threats against Iranian infrastructure were carried out. The comments came in response to President Trump's remarks on Tuesday evening that Iranian infrastructure could be targeted in the coming week unless further progress is made in negotiations.
Concerns over additional disruptions to global energy supplies increased on Thursday following a Reuters report suggesting another key oil route could come under pressure. According to the report, the Iranian government has asked its Houthi allies to help close the Red Sea if U.S. strikes target Iranian infrastructure. Control of the Strait of Hormuz remains the central point of disagreement between Iran and the United States, with neither side showing signs of compromise over access to the critical trade corridor.
Oil flows through the Strait continue to run well below levels seen prior to the collapse of the ceasefire. The seven-day moving average has fallen from 8.5 million barrels per day to just 3.9 million barrels per day. Despite the escalating rhetoric, crude oil (/CLU26) finished lower on the session, falling 1.66% to settle at 78.28.
On the economic front, Thursday's releases of U.S. weekly initial unemployment claims, June retail sales, and the July Philadelphia Fed Business Outlook Survey all pointed to continued economic resilience. Initial unemployment claims fell by 8,000 to a 10-week low, while the Philadelphia Fed survey jumped 31.1 points to a four-and-a-half-year high, handily exceeding expectations. June retail sales increased 0.2% month over month, matching consensus forecasts.
The stronger economic data, coupled with hawkish commentary from Federal Reserve officials Jeff Schmid and Lorie Logan, tempered optimism surrounding Fed policy following the better-than-expected CPI report earlier this week. As a result, markets are now pricing in roughly a 10% probability of a rate hike at the Fed's next FOMC meeting later this month.
Technicals
On the daily chart, September S&P 500 futures (/ESU26) snapped a two-day winning streak as prices continued to trade largely sideways throughout the month. Futures remain just 1% below the all-time highs set on June 15. Price continues to hold above the 20-day simple moving average after briefly testing the level on Thursday and remains approximately 1% above the 50-day SMA, a level that successfully held as support on two occasions during June.
The 14-day RSI finished at 54.57, signaling mildly bullish but generally neutral momentum. Volume increased slightly on Thursday, with 1,241,241 contracts traded, though activity remained below the 50-day average of 1,471,080 contracts.
According to the Daily Hightower Report, /ES may find support at 7,528.88 and 7,496.69, with resistance at 7,612.62 and 7,664.18.
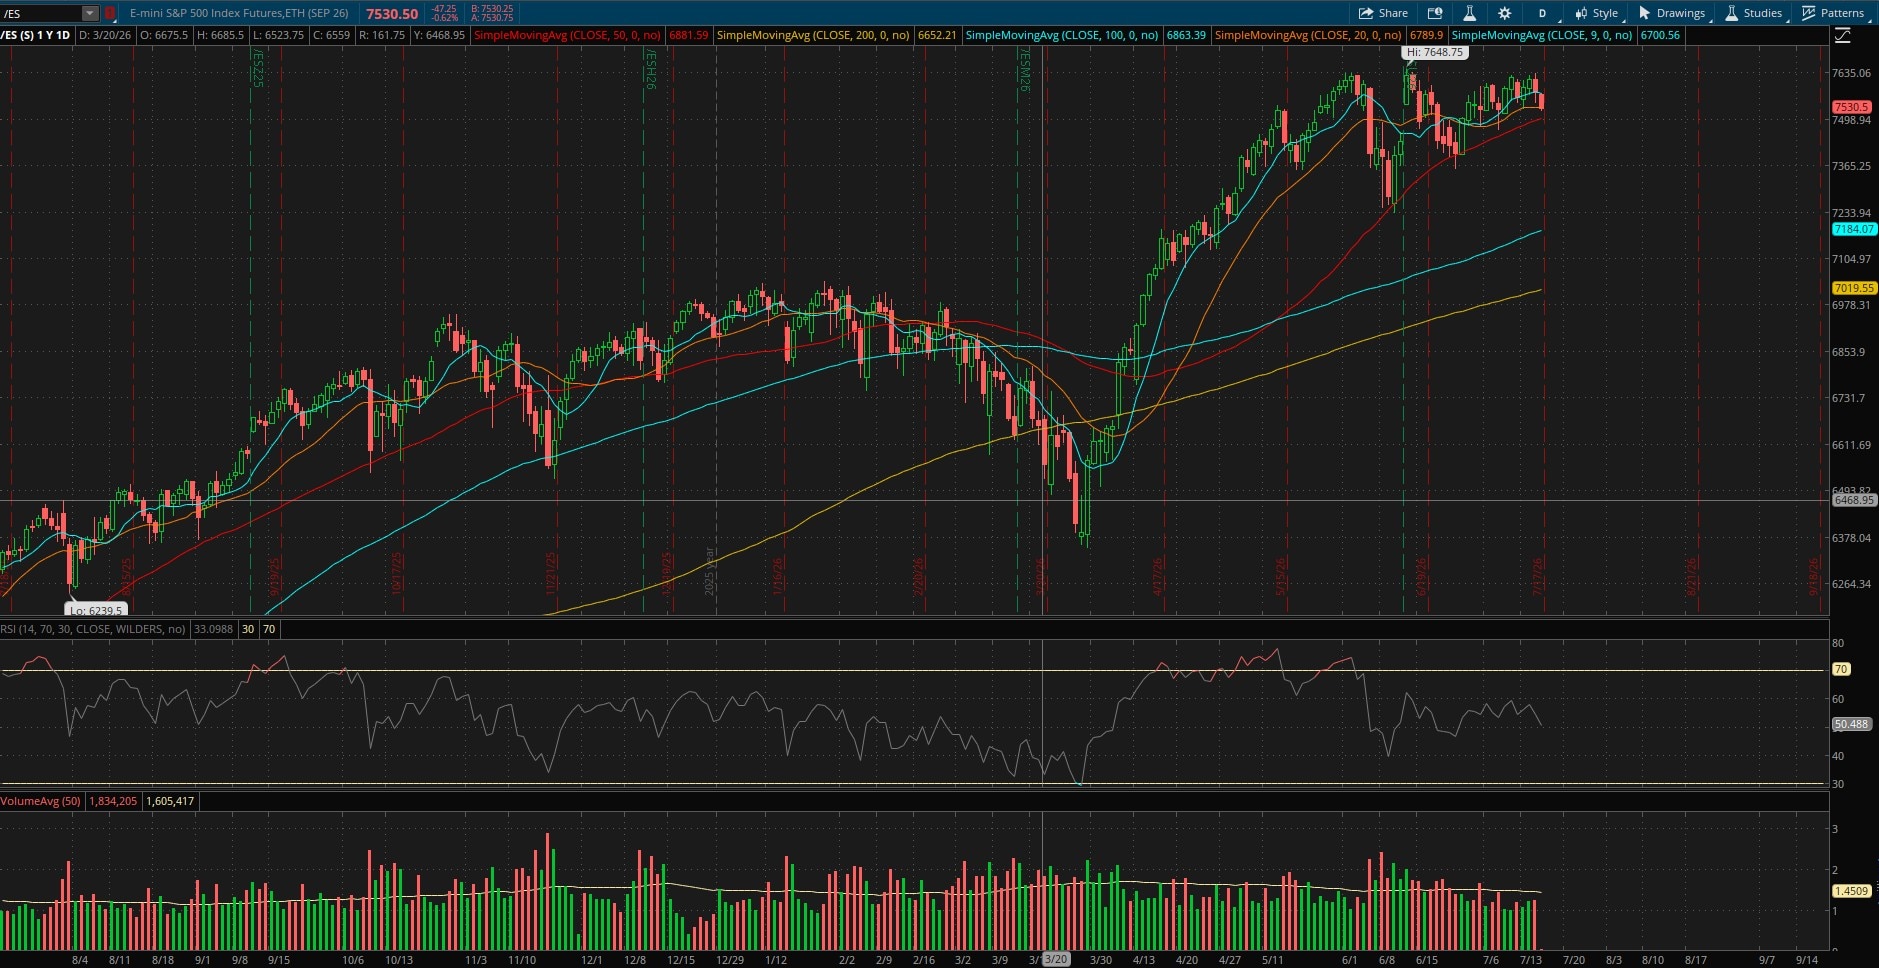
9-Day SMA: 7580.81
20-Day SMA: 7532.15
50-Day SMA: 7496.03
100-Day SMA: 7177.28
200-Day SMA: 7015.46
14-Day RSI: 54.5668
50-Day Vol Avg: 1,471,080
Contract Specifications
What else to watch today
Major economic reports, trading events, and news items that could potentially impact specific futures markets:
Economic Events/Data Friday, July 17, 2026 (ET)
8:30 am ET- Import Price Index
8:30 am ET- Import Price Index Minus Fuel
8:30 am ET- Housing Starts
8:30 am ET- Building Permits
9:15 am ET- Industrial Production
9:15 am ET- Capacity Utilization
10:00 am ET- Consumer Sentiment (Prelim)
New Products
New futures products are available to trade with a futures-approved account on all thinkorswim platforms:
- Ripple (/XRP)
- Micro Ripple (/MXP)
- 100 OZ Silver (/SIC)
- 1 OZ Gold (/1OZ)
- Solana (/SOL)
- Micro Solana (/MSL)
Visit the Schwab.com Futures Markets page to explore the wide variety of futures contracts available for trading through Charles Schwab Futures and Forex LLC.