2026 Mid-Year Outlook: Municipal Bonds

Key takeaways
- In our view, municipal bonds are an attractive area for fixed income investors—particularly those in higher tax brackets that are seeking tax-aware income, relatively low volatility, and historically strong long-term credit characteristics.
- Elevated supply, a less certain rate backdrop, and growing dispersion among issuers mean there may be more headwinds facing the municipal bond market in the second half of 2026.
- In our view, while our outlook for the second half of 2026 is generally favorable, risks remain. Elevated supply may make investor demand an important factor in market performance, while inflation and geopolitical developments may continue to pose risks to the broader market.
Municipal bonds enter the second half of 2026 with a strong case for investors seeking dependable, tax-efficient income in our view. We believe munis can offer a compelling case of attractive tax-adjusted yield for investors in higher tax brackets while broad credit fundamentals are still sound. Elevated supply, a less certain rate backdrop, and growing dispersion among issuers mean there may be more headwinds facing the market in the second half of the year than has been the case in recent years. A key question for the second half of the year is whether investor demand will remain strong enough to absorb elevated issuance without pushing muni yields higher.
Why municipals still matter
Municipal bonds continue to offer a compelling combination of income, potential tax efficiency, and high credit quality on average. For investors in higher tax brackets, that combination remains difficult to replicate elsewhere in fixed income. For example, the yield to worst (which is the lowest possible yield an investor can receive from a callable bond, barring default) on the Bloomberg Municipal Bond Index was 3.6% as of June 12. That can translate into a taxable-equivalent yield of roughly 6% or more for an investor in the top tax bracket before factoring in any state tax benefit. In our view, that is a meaningful level of after-tax income for a high-quality asset class.
Munis may offer compelling yields relative to alternatives after considering taxes
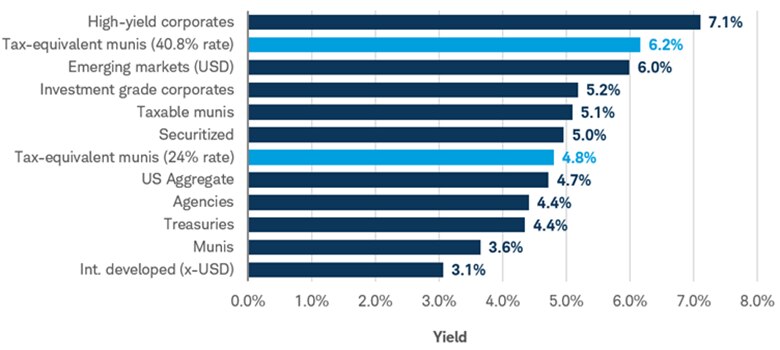
Source: Bloomberg. Yield as of 6/12/2026.
Indexes representing the investment types are: High-yield corporates = Bloomberg US High Yield Very Liquid (VLI) Index; Investment grade corporates = Bloomberg US Corporate Bond Index; US Aggregate = Bloomberg US Aggregate Index; Municipals = Bloomberg US Municipal Bond Index; Treasuries = Bloomberg US Treasury Index; Emerging markets (USD) = Bloomberg Emerging Markets USD Aggregate Bond Index; Securitized = Bloomberg US Securitized Index; Agencies = Bloomberg US Agency Bond Total Return Index; Int. developed (x-USD) = Bloomberg Global Aggregate ex-USD Bond Index.
Indexes are unmanaged, do not incur fees or expenses, and cannot be invested in directly. Past performance is no guarantee of future results. For illustrative purposes only.
Municipals have also historically exhibited lower volatility than many other bond sectors. They are not immune to drawdowns—especially when rates rise quickly—but the combination of coupon income and generally stable credit quality has often helped cushion downside for total returns relative to other fixed income categories. For investors who want tax-aware income without taking on outsized default risk, that matters.
Credit quality is another central part of the case. Broad municipal fundamentals are no longer benefiting from the extraordinary fiscal tailwinds that followed the pandemic, but they remain solid overall. State reserve levels are still elevated by historical standards, revenue growth remains above its longer-term trend, and defaults for investment-grade municipals remain exceptionally low over long periods. That does not mean all sectors are equally healthy, but at a broad level, municipal credit remains stable in our view.
State tax revenues are growing above their longer-term average
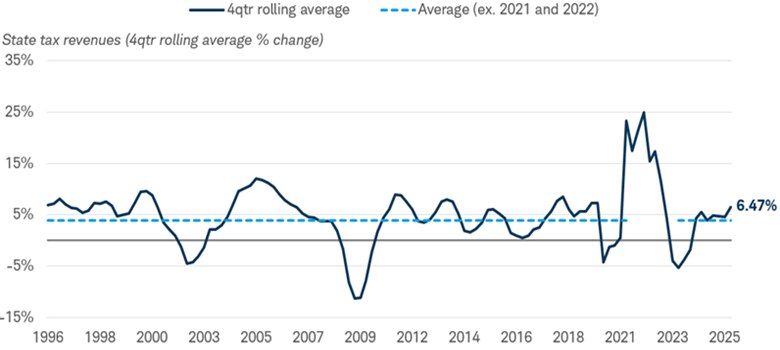
Source: Bloomberg.
US Census State Tax Collections Total Taxes US Total Ex DC (STTLTOT Index). Data from 12/31/1996 through 12/31/2025.
Average excludes 2021 and 2022 to remove the spike in the post-COVID period.
The second half story is about demand
The key variable for the remainder of the year is whether investor demand remains strong enough to absorb elevated supply without pushing yields materially higher. According to Bloomberg, through May, year-to-date municipal issuance reached $238.1 billion, up 8.6% from the same period a year earlier and 60.0% more than the average going back to 2023.
Elevated muni issuance could weigh on returns unless demand keeps up
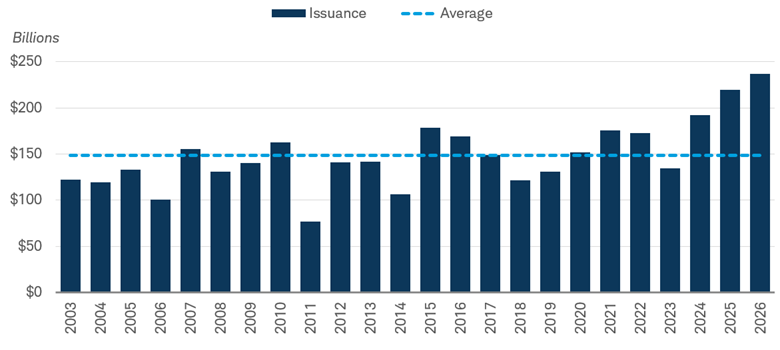
Source: Bloomberg.
Bloomberg Municipal YTD Issuance Total (YTDMTOT Index).
Year-to-date data from 2003 to 2025 for each year through the end of May. Year-to-date issuance through 5/31/2026.
There are several reasons why supply has stayed high. First, issuers continue to face higher infrastructure costs after several years of persistent inflation in labor and materials. Second, the era of unusually generous post-pandemic fiscal support has faded, leaving more projects to be financed via bond issuance. Third, many issuers still see current funding needs as too important to delay, even if borrowing costs remain above pre-2022 norms.
That elevated supply does not automatically imply a poor outcome for total returns. In fact, it can create opportunities by improving bond selection and occasionally cheapening valuations. But it does mean total returns are more sensitive to market technicals than they would be in a low-supply environment. If reinvestment flows, fund inflows, and separately managed account demand all remain firm, municipals can continue to grind out positive performance. If demand softens, the market may need higher yields to clear new issuance, and that could weigh on prices and therefore returns.
So far, the market has handled the environment reasonably well. The Bloomberg US Municipal Bond Index was up about 1.6% year to date through June 12.
Muni performance has fared well compared to other fixed income investments this year
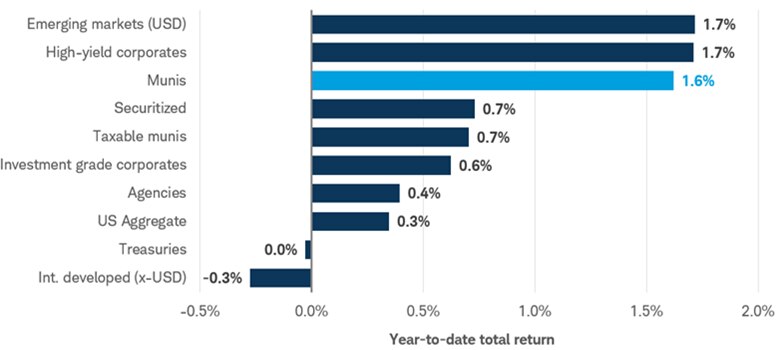
Source: Bloomberg, as of 6/12/2026. Returns from 12/31/2025 to 6/12/2026.
Bloomberg Municipal Bond Index (Munis), Bloomberg US Agg Agency Index (Agencies), Bloomberg US Treasury Index (Treasuries), Bloomberg US Corporate High Yield Index (High-yield corporates), Bloomberg US Aggregate Bond Index (US Aggregate), Bloomberg US Corporate Bond Index (IG corporates), Bloomberg Taxable Municipal Bond Index (Taxable munis), Bloomberg Global Aggregate ex-USD Index (Int. developed (x-USD)), US Securitized: MBS, ABS, and CMBS (Securitized) and Bloomberg EM USD Aggregate Index (Emerging markets (USD)). All returns shown are pre-tax. Indexes are unmanaged, do not incur fees or expenses, and cannot be invested in directly. Past performance is no guarantee of future results.
Rates, inflation, and the risk to total returns
A threat to municipal total returns over the balance of the year is a renewed move higher in longer-term yields. Municipal bonds usually follow the broad direction of U.S. Treasury yields. That means if Treasury yields move higher due to higher inflation expectations, or Treasury term premiums rise, it could weigh on muni performance too.
Geopolitics adds to that risk. Although a tentative deal was reportedly reached recently, there are concerns in the market that it may not be sustainable. A longer-lasting conflict in Iran or broader Middle East instability could keep oil prices elevated for longer than markets currently expect. Higher oil prices do not just affect gasoline. They can feed through to transportation, shipping, utilities, and other input costs, which can keep inflation elevated even if core trends are otherwise moderating. That matters because sticky inflation can make it harder for long-term yields to decline and can even push them modestly higher. For municipal investors, higher yields mean lower bond prices, which can hurt total returns.
Our base case is still for longer-term rates to remain broadly rangebound rather than break out sharply higher, though that outlook is uncertain. However, the outlook for rates is skewed to the upside in our view, which means investors should be cautious about taking any outsized duration positions.
Credit quality remains stable, but dispersion is rising
Broad municipal credit conditions remain relatively stable in our view. State and local balance sheets are not as flush with cash as they were at the peak of post-pandemic strength, but they are still healthy by historical standards. Reserve levels remain elevated, most states continue to show disciplined budgeting, and revenue growth is above its longer-term average.
The number of days the median state could run off its rainy day fund alone has declined but is near record highs
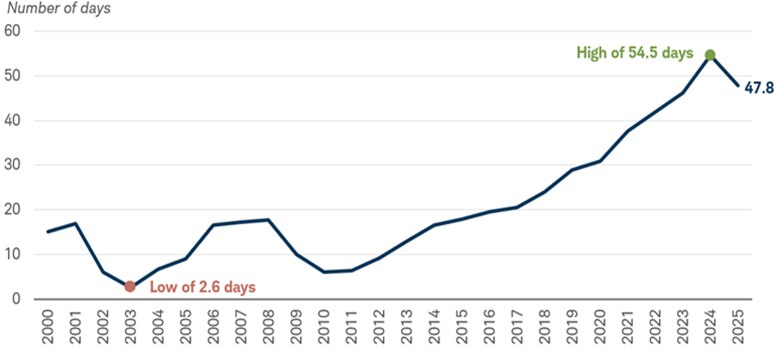
Source: The Pew Charitable Trusts, Reserves and Balances Data.
Data as of the end of fiscal year 2025. Report released 3/24/2026.
That said, investors should not confuse a stable market-level credit outlook with uniform strength across sectors. Dispersion is rising. In a market where the broad tide is no longer lifting every issuer, security selection matters more. Essential service sectors and many high-grade state and local issuers still appear fundamentally more resilient than some other areas in the market. But sectors with greater operating leverage or business-model pressure deserve closer scrutiny.
Healthcare and education are two of the areas where caution is still warranted. Hospitals continue to face reimbursement pressure, labor cost inflation, and affordability challenges. Higher education issuers remain highly uneven, with flagship public systems generally in much better shape than smaller, tuition-dependent institutions. In our view, that argues for selectivity rather than a wholesale rejection of the sectors. But it also means investors should demand adequate compensation for the added risk rather than simply reaching for yield.
Portfolio positioning ideas for the rest of the year
Our strategic bias is to stay modestly defensive on interest-rate risk. That starts with maintaining slightly below-benchmark duration. The logic is simple: yields remain attractive, but the asymmetry of rate risk is not especially favorable if long-term Treasury yields drift higher because of inflation, energy, or term-premium concerns. Investors do not need to avoid duration entirely, but they should be deliberate about how much they own.
A laddered approach may still make sense for many investors, depending on their goals, time horizon, and liquidity needs. A ladder can help balance reinvestment flexibility with the opportunity to lock in attractive yields farther out the curve. In the current market, longer maturities can offer more compelling valuations relative to Treasuries as illustrated in the chart below. The trade-off is that longer bonds are more sensitive to rate moves. For investors who can tolerate greater price volatility, selectively extending maturities can still be sensible. For investors with shorter time horizons or lower risk tolerance, keeping the bulk of exposure in intermediate maturities may be more appropriate.
Yields relative to Treasuries for longer-term munis are higher than for short-term munis
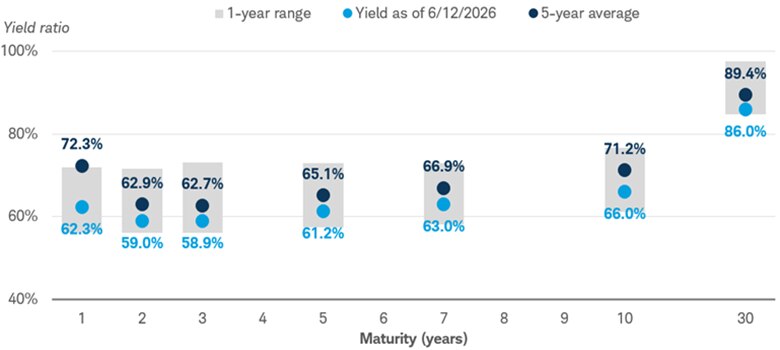
Source: Bloomberg.
BVAL AAA Munis as a % of Treasury. As of 6/12/2026. 1-year range begins on 6/12/2025 and the 5-year average begins on 6/12/2021. For illustrative purposes only. Past performance is no guarantee of future results.
On credit, we continue to favor highly rated issuers as the core of a municipal allocation. This is not because we expect broad municipal credit deterioration. Rather, spreads in many areas remain relatively tight, which means investors are not being compensated for added credit risk. State-specific relative value also matters. For national investors, spreads in large, well-followed states such as California and New York may not always offer enough incremental compensation relative to generic high-grade alternatives. By contrast, some issuers in states such as Texas may offer a modest yield pickup. That said, broad state-level observations should not be overgeneralized. Index-level spread comparisons can obscure large differences among individual issuers, structures, and sectors. In addition, the municipal market is heavily concentrated in a handful of large states, which means portfolios cannot always avoid them entirely without sacrificing diversification or liquidity.
Spreads for state general obligation (GO) bonds vary by issuer
| State | 10-year GO Yield | Spread Relative to Generic 10-year AAA Index (bps) | Moody's Credit Rating | % of Index |
|---|---|---|---|---|
| Illinois | 3.55 | 62 | A2 | 3.8% |
| New Jersey | 3.15 | 21 | Aa3 | 2.9% |
| Texas | 3.11 | 17 | Aaa | 11.3% |
| Pennsylvania | 3.10 | 16 | Aa2 | 3.6% |
| Washington | 3.07 | 14 | Aaa | 2.9% |
| Massachusetts | 3.04 | 11 | Aa1 | 3.6% |
| Florida | 3.03 | 10 | Aaa | 3.9% |
| California | 2.94 | 1 | Aa2 | 16.6% |
| Georgia | 2.94 | 0 | Aaa | 2.4% |
| New York | 2.78 | -15 | Aa1 | 16.3% |
The practical takeaway is to keep the portfolio core simple and disciplined: emphasize quality, be selective in sectors with operating pressure, and use curve positioning intentionally rather than reflexively.
Bottom line
Municipal bonds remain one of the more attractive areas of fixed income for investors who value tax-aware income, relatively low volatility, and strong long-term credit characteristics. The case is especially compelling for investors in higher tax brackets, but it is also relevant for investors who simply want a more conservative source of income within a diversified portfolio. In our view, while our outlook for the second half of 2026 is generally favorable, risks remain. Elevated supply may make investor demand an important factor in market performance, while inflation and geopolitical developments may continue to pose risks to the broader market.