Inflation: The Heat Is On?

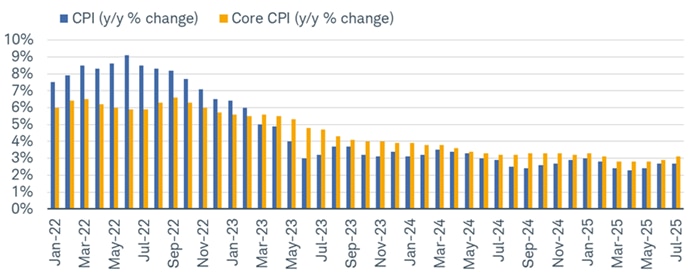
Nearly two months ago, we penned a report discussing the possibility of (our term) "complation," or too much complacency regarding inflation. At the time with May inflation data in hand, there wasn't much of a discernible impact from tariffs; the same cannot necessarily be said now. The Consumer Price Index (CPI) has seen its year-over-year (y/y) rate move higher, as has the core CPI, which excludes food and energy. As shown in the chart below, y/y growth rates have started to creep back up—to 2.7% and 3.1%, respectively.
Inflation's higher floor?
Source: Charles Schwab, Bloomberg, Bureau of Labor Statistics (BLS), as of 7/31/2025.
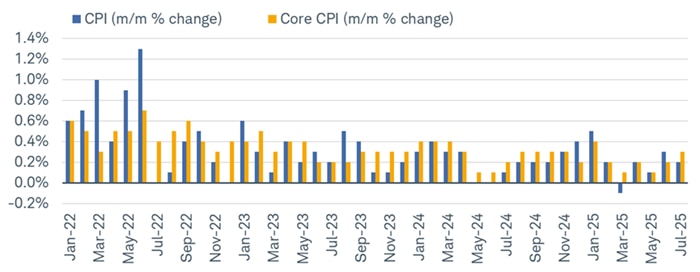
Some of the summer heat in CPI can be seen when looking at the month-over-month (m/m) changes, which also helps eliminate any of the base effects associated with y/y changes. As you can see in the chart below, the gains in June and July were hotter for both headline and core CPI. In fact, the latter's increase of 0.3% in July was the second largest increase this year.
Reheating in the summer
Source: Charles Schwab, Bloomberg, Bureau of Labor Statistics (BLS), as of 7/31/2025.
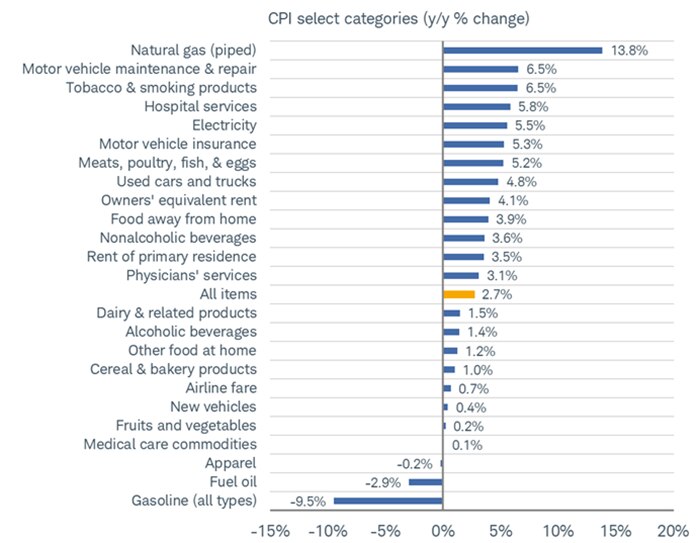
In terms of what's helping keep CPI's y/y change elevated, it's a mix across the energy, goods, and services spectrum. At the top is natural gas (up nearly 14% y/y), followed by motor vehicle maintenance, tobacco, and hospital services. On the opposite end, it's clear that energy has been helping put downward pressure on headline CPI, given gasoline and fuel oil are both down notably (which helps explain why core CPI y/y is currently outpacing headline CPI y/y).
Price pressure broad-based
Source: Charles Schwab, Bloomberg, Bureau of Labor Statistics (BLS), as of 7/31/2025.
Pressure in the wrong spot?
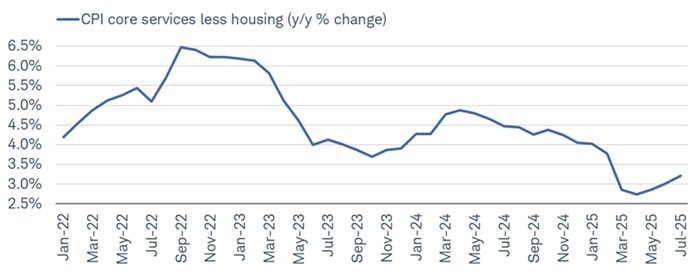
Of late, we've continued to stress the importance of looking under the surface of economic reports, as there is arguably a much more interesting (and consistent) story when assessing the details. Looking at the core services ex-housing version of CPI (sometimes called "supercore")—which tracks less cyclical price pressures for a broad swath of the economy (given the U.S.' services bias)—you can see in the chart below that y/y growth has begun to reaccelerate. Fortunately, it's nowhere close to its peak at the height of the 2022 inflation craze; but in fairness, it averaged 2.2% in the five years leading up to the pandemic, which means that it will be very challenging for the Federal Reserve to get close to its 2% inflation goal if supercore inflation doesn't ease materially.
Supercore CPI hooking higher again
Source: Charles Schwab, Bloomberg, Bureau of Labor Statistics (BLS), as of 7/31/2025.
An added rub is when we put core goods back into the picture, there are arguably some tariff-related pressures coming into the mix. One of the difficulties in assessing how overall inflation will be impacted by tariffs is twofold: goods is a smaller portion of the economy (and inflation), and the implementation of tariffs has been rolling in nature. That means tariffs' specific hit to prices is tough to discern on a month-to-month basis.
Regardless, core goods prices have heated up this year, as shown by the three-month annualized change in the chart below. Unfortunately, headline inflation is no longer benefiting from the decline in goods prices, as was the case from 2023 into 2024. That is happening as core services prices are bouncing again (shown via the yellow line).
Core regaining strength
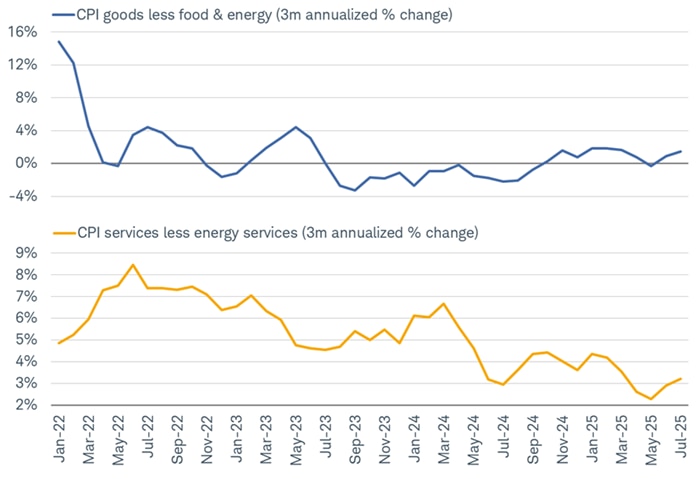
Source: Charles Schwab, Bloomberg, Bureau of Labor Statistics (BLS), as of 7/31/2025.
Misperceptions
Moving on to producer prices, a definition is essential here. There is frequently a misperception about what the Producer Price Index (PPI) is measuring—typically billed as the prices that are paid by producers. In fact, the PPI measures the average change over time in the selling prices domestic producers receive for their output. It essentially tracks price changes from the perspective of the seller, focusing on the prices producers get for goods and services as they are initially sold.
The PPI covers a wide range of industries, including manufacturing, mining, agriculture, and various service industries. It is categorized into final demand and intermediate demand, with the important final demand referring to goods and services sold to the end consumer.
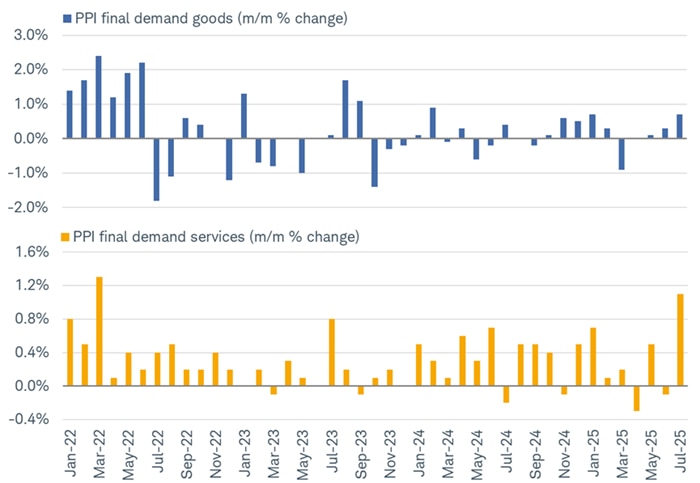
Last week's release of the PPI was a bit more jaw-dropping relative to the CPI. The headline reading for July was +0.9% m/m (3.3% y/y), the highest monthly reading since the inflation-heady days of 2022 (March to be exact). The reading was significantly north of the 0.2% consensus expectation.
As shown below, most of the surge in the PPI in July was driven by services (+1.1% m/m) relative to goods (+0.7% m/m).
Producer price pressures, especially services
Source: Charles Schwab, Bloomberg, Bureau of Labor Statistics (BLS), as of 7/31/2025.
Given the aforementioned misperception that PPI is a "prices paid" metric, a related assumption is often that if PPI is running hotter than CPI, it suggests downward pressure on profit margins. This is decidedly not the case when looking at the trade services component of the PPI.
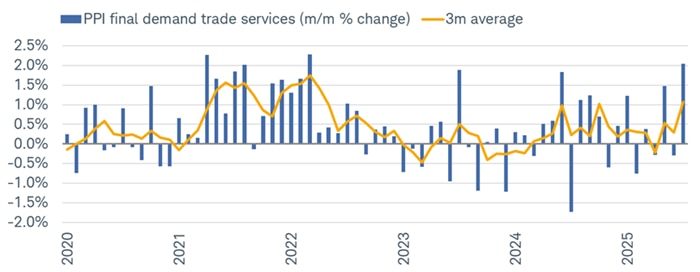
Trade services measures changes in the margins received by companies involved in the resale of goods—specifically wholesalers and retailers. It shows the difference between selling prices and acquisition costs. In other words, trade services tracks how much companies receive from reselling goods, rather than the prices of the goods themselves. The PPI treats trade businesses (wholesalers and retailers) as suppliers of services because they don't typically alter the goods they sell before reselling them. Their output is measured by the margin they earn, which is the difference between the selling price and the purchase price of the goods.
As such, the trade services index focuses on the price changes of these margins, reflecting how much profit businesses are making from facilitating the movement of goods from producers to consumers. As shown below, trade services spiked in July, with the three-month average having clearly turned higher. It more than just suggests that higher tariffs being paid (reminder: tariffs are not paid by the targeted countries…they are paid by U.S. companies importing goods from the targeted countries) are starting to get passed on to consumers.
Surging margins
Source: Charles Schwab, Bloomberg, Bureau of Labor Statistics (BLS), as of 7/31/2025.
Looking ahead, which consumers do when they're queried by the University of Michigan (UMich) in its monthly Consumer Sentiment survey, inflation expectations have turned higher, as shown below. Alongside a renewed slump in overall sentiment about the economy, the August UMich survey showed an increase in near- and longer-term inflation expectations. The turn higher was broad-based across age/demographic groups and political party affiliations.
Inflation expectations turn back up
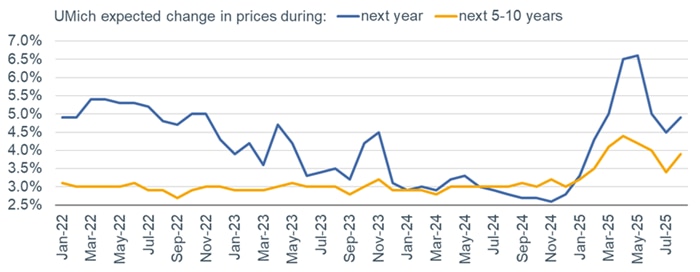
Source: Charles Schwab, Bloomberg, University of Michigan (UMich), as of 7/31/2025.
Chart plots median inflation Forecasts contained herein are for illustrative purposes only, may be based upon proprietary research and are developed through analysis of historical public data expectations.
In sum: Fed edition
In the aftermath of inflation prints last week, the market is now pricing in a lower (but still high) odds of a September rate cut by the Federal Reserve. Based on the CME's Fed Watch Tool, those odds are now 85%, down from the mid-90s% area prior to those inflation releases. What did change was the probability of a 50-basis-point cut, which immediately dropped to 0% in the aftermath of the PPI report. Barring a hot print by the Personal Consumption Expenditures (PCE) inflation reading next week and/or a stronger-than-expected set of readings on labor market conditions, we are still penciling in (though perhaps not penning in) a September rate cut of 25 basis points.